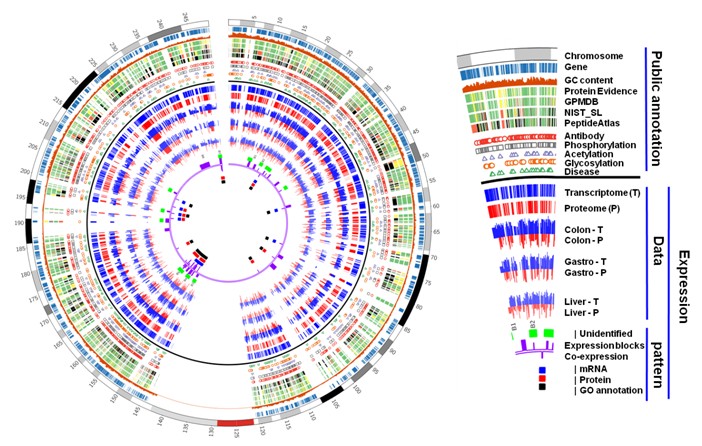
The statistics information of human liver proteome datasets
1.Overview of the human liver proteome datasets
2.High quality proteome data for human liver
3.Overlap of identified proteins from different samples
4.Identifications within Human liver organelles and Human liver cancer cell lines
The proteomic analysis of encoding genes on
human chromosome 1
The first proteomic survey to the encoding genes on human chromosome 1.

Figure 1. Flow chart of the experimental strategies and data processing methods.

Figure 2. General description of proteome identified results. A. Number of identified peptides and proteins in the three different tissues and their corresponding cell lines; B. Overlap of identified proteins in these three tissues; C. Identified proteins in different chromosomes. The three chromosomes that the CCPC devotes to are highlighted. The identified protein number over the total protein number in different chromosomes are showed near the highlighted bar. The percentage of identified proteins for different chromosomes could be found in the above line; D. Identified protein distribution in Swiss-Protí»s five different evidences; E. Overlap of identified peptides with Human PeptideAtlas and NIST_SL; F. Overlap of high confidence identified proteins with GPMDB, NIST_SL and PeptideAtlas.

Figure 3. Protein quantitation distribution and the cluster analyses of proteome expression data for liver, gastric and colon samples. A. The distribution of protein abundance. B. The clustering of different samples. C. The clustering analysis of proteome data from 17 different samples. The analyses of gene function in different clusters indicates the potential different functions in different tissues.

Figure 4. Overview of the identified proteins in chromosome 1. A. Distribution of protein-coding genes and identified genes in chromosome 1. The red line is the identified gene number, the blue is all protein-coding gene number; B. Identified/unidentified gene number for protein evidence in Swiss-Prot, high quality mass spectra from GPMDB, NIST_SL, HPA, antibody and disease; C. The overlap of the three PTMs and the identified proteins; D. Identified protein number in the enriched pathways of chromosome 1; E. Analyses of Missing proteins in chromosome 1. The missing proteins are matched to the above three mass spectra databases, and were separated into three datasets: 333 matched to high confidence mass spectra data, 432 matched to low confidence data and 40 could not match to the three databases. The four datasets are compared by their physicochemical properties and mRNA abundance.

Figure 5. Gene expression blocks in chromosome 1. There are seven gene expression blocks closing to centromere or terminal of the two chromosome arms. Of them, 5 blocks (Block 1, 2, 4, 5, 7) are absent or low expressed in transcriptome and proteome, which contain many homology genes and should be caused by tandem duplication. The other two blocks (Block 3, 6) seems to be low abundance or missing in proteome data, but with median or high abundance in transcriptome data.

Figure 6. Gene co-expression clusters. A. Regions of gene co-expression and co-function clusters in human chromosome 1, and heatmaps of gene co-expression cluster 1, 3, 18 and 20. The blue and red horizontal lines indicate the locations of co-expression clusters found by using mRNA data (R) and proteomic data (P), respectively. The black horizontal lines indicate the locations of co-function clusters found by co-function analysis (F). Co-expression clusters with at least two kinds of evidences were displayed here. Heatmap was displayed using the pearsoní»s correlation coefficients of all gene pairs in a cluster. Cluster 1, 18 and 20 were displayed using mRNA expression data while cluster 3 were displayed using protein expression data. The intensity of the color in the heatmap indicates the degree of correlation. Genes with red words indicate the co-expressed genes. B. An example of cancer-suppressor related gene co-expression pair in cluster 20. CSRP1 located in 1q32.1 may be involved in the progression of colorectal cancer, and LAD1 is the co-expressed gene. Both of the two genes were found over-expressed in colon normal tissue but under-expressed in colon cancer tissue based on our proteome and transcriptome quantification results. The XIC of each high-confident unique peptide was extracted using Xcalibur (v2.2).


